QGIS plugin
1 Opening a model
This guide assumes you have already installed the Ribasim core and QGIS plugin as described in the install page.
Use any running Ribasim model to follow this guide. For ready-made example models download and unzip generated_testmodels.zip from the release assets, and use for instance the basic test model.
You can open a model by clicking on the Ribasim icon, and selecting a TOML file.

Alternatively, drag a TOML file into QGIS.
2 Running a model
Right-click on the model in the Layers panel and select Run Ribasim model from the context menu.

This will run the simulation in the background, showing progress in the QGIS task manager and a live output dialog. When the simulation completes successfully, the model results are automatically reloaded.

For QGIS to find the Ribasim executable, it must be configured via RIBASIM_HOME. See the install section for details.
3 Inspect a (large) model
For larger models the node tables can grow quite large. To facilitate inspection, the tables are linked via the node_id field to the Node table, and react to the selection of the Node layer. That is, on selection of certain nodes—either via the map or the attribute table—the selection is also made in all related tables. This is also the case for the Link layer. It helps to set the attribute table of a table of interest to show selected features only (using the dropdown button on the bottom left).
4 Inspecting results
Before inspecting the results, verify that the run was successful and the output files are there.
Click the “Time Series” button of the iMOD plugin.

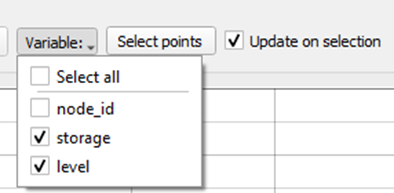
Select the layer that you wish to plot. From the “Node” layer you can plot level or storage on Basin nodes. From the “Link” layer you can plot flow over flow links. Note that before switching between these, you typically have to click “Clear” to clear the selection. If you run a simulation with the model open in QGIS, you have to close and re-open the “iMOD Time Series Plot” panel for the new results to be loaded.
Select the variables that you want to plot.

Click “Select points” and select a node by dragging a rectangle around it on the map. Hold the Ctrl key to select multiple nodes.

The associated time series are shown in the graph.

Only the basin.nc and flow.nc can be inspected with the “iMOD Time Series Plot” panel. All result files can be loaded as a layer by dragging the files onto QGIS. Right click the layer and select “Open Attribute Table” to view the contents.
5 Reloading models
If you made changes to your model outside of QGIS, and want to see the new version in QGIS, the quickest way is to click “Reload Ribasim model” in the model group’s context menu, as shown below:

This avoids the need to remove the group and open the same model again via the plugin. It can be convenient when iteratively building your model via Python, or running new simulations.